Qgis tutorial for making maps
A guide by Charles / Liberec / Kuhx / all the other aliases
[Link to a list of resources & a guide on making objectively good maps at the bottom]
Foreword
Qgis is what I've been using since I started making maps, it's absolutely something you can learn as a beginner, and I even recommend it because it'll be harder to switch later. Qgis saves an immense amount of time making maps when compared to other methods like tracing basemaps. While learning it isn't so easy, I can promise you that you won't regret it.
Qgis is not like a traditional mapmaking software, you won’t be able to make a full map in it (you often don't have a good reason to).
Think of it more like a way to make a basemap which is tailored for your map and that you don’t have to trace and can start editing as-is. If there is anything that confuses you, please tell me in the comments below! My aim is for this tutorial to ultimately cover the basics of making map in Qgis, the various styles you can make one in and how you should go about doing this. I will be covering how to make topographic and other types of maps.
I should also note that "raster" means that it's made out of pixels, while "vector" means that it's made out of "vectors." Which are math equations which can be scaled however you like. QGIS stands for Quantum Geographic Information System and it is a 'vector' program.
With all that said, let’s get started.
Setting up resources
I have made another page which includes all the resources you need for Qgis, most notably Natural Earth and Viewfinderpanoramas.
Create a folder someplace you have a lot of storage called "Qgis" in it, make one subfolder titled "resources" and another one titled "exports". Now unzip the downloaded resources & put them in the 'resources' folder.
In reality it's really up to you how to organize them, but I find that this way works best for me.
All you have to do to put these resources in the program is to simply drag them in from the folder, (or alternatively navigating to the folder in Qgis & double clicking on the resources).
Layer properties
After putting in one of your resources into Qgis, you'll see them in the "layers" box at the bottom left of your screen.
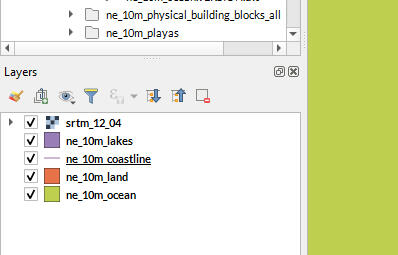
Quick tip: The icon second most to the left under the text saying "layers" which looks like a bunch of interlocked squares is the icon to make layers. So if you shift click a layer & then another one a few steps above - you'll make a group.
I should note some basic terminology. Shapefiles, is just the unabbreviated version of .shp, which you'll see on the vector resources you downloaded.
When you double click a layer you'll open up its symbology tab, which looks different depending on what type of file it is. Don't be intimidated by the loads of different tabs on the left of the popup screen like '3d views', 'diagrams', 'auxiliary storage' 'temporal ´ etc.
The most important parts for this tutorial are 'Symbology' & 'Labels'.
It'll look mostly the same if you're dealing with paths, polygons, dots etc. although it'll look quite different if you open a .tiff (heightmap) file.
The labels tab is the simplest, so I'll start by explaining it. It'll be set to "no labels" when you go into the tab. To add labels you change this to one of the other options. You can look around a bit at them and wonder what they do, but the most important for this way of doing things is the 'single labels' option. What it does is pretty self-explanatory.
However, I should note that if you're doing cities you want to set the 'placement' (in placement > placement) to "Cartographic" so that the program will put the labels around the points, but so that they fit better.
The Symbology tab (for Shapefiles) is for editing how the line/dot or whatever shapefile you're using looks. In it, you'll see a copy of how the shapefile (resource) looks in the legend. If you double click on that you'll see the symbology tabs opens up more options on how you can edit it. You can also press the plus icon to add another layer on top of the original, so you can layer them to create more complex effects.
I encourage you to play around a bit with the features and see what each of them do.
Topography
when you open a .tiff file (heightmap) it will be in 'singleband grey', if you don't want to make a greyscale map you want to switch this into singleband pseudocolour.
The green plus icon adds new boxes. In these boxes you can assign a colour & a height (double clicking on the box allows you to change colour, the value beside it changes the height). If I recall correctly you can change the units in settings but the default as far as I know is in meters.
You can also have different ways to blend these values. "Discrete" means they're layered on top of each other while "linear" means they're going in a gradient from one to another.
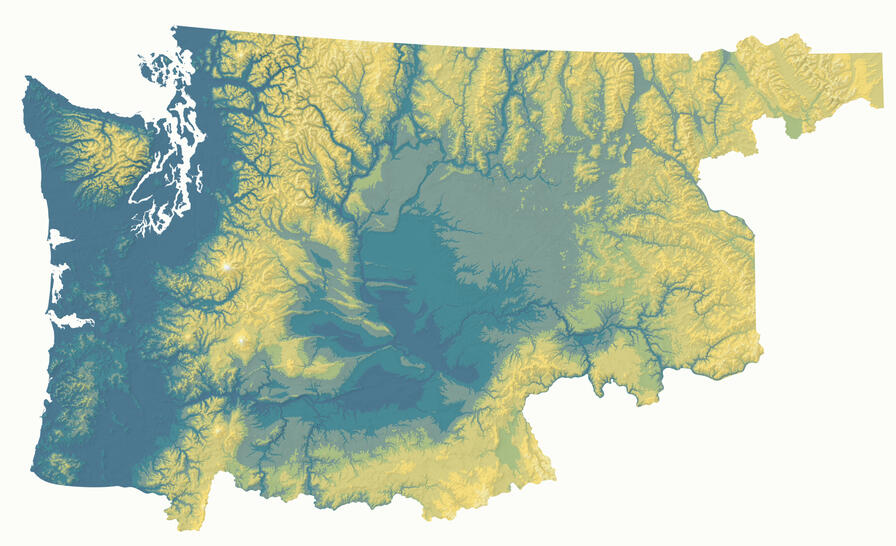
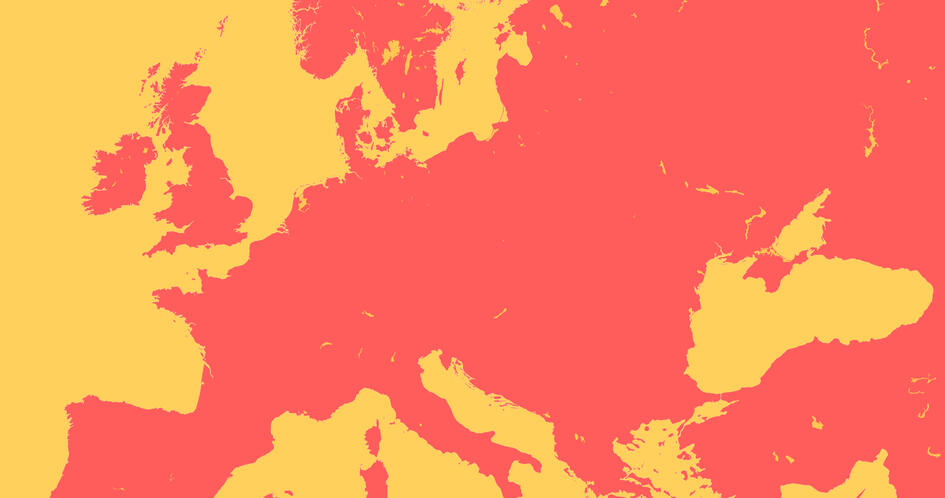
If you add in another .tiff file you can put it on top of the other one and put it on hillshade & multidirectional while putting the blending mode on "multiply" and the transparency (in another tab) to something lower you can make something like what I made:
Plugins & QuickOSM
Plugins for Qgis can be found at the very top of the screen. When you click on the text you'll see a dropdown menu appear, on it click 'manage and install plugins'. In the popup menu that appears, you'll see different ways of viewing all plugins. You'll see an option to see all plugins in existence, one to see installed ones and ones to see uninstalled ones, along with some others.
Since QuickOSM is uninstalled you'll have to go to the 'uninstalled' part and search for it. Click on the little icon & text showing it and install it.
Great, now you know how to install plugins. There are loads of them, so I won't go through how to use them. But you can search for QuickOSM tutorials and follow them should you decide to use it. Here's the one I used to learn how to use it:
https://www.youtube.com/watch?v=BMzJNScR76U&ab_channel=HansvanderKwast
Filtering shapefiles
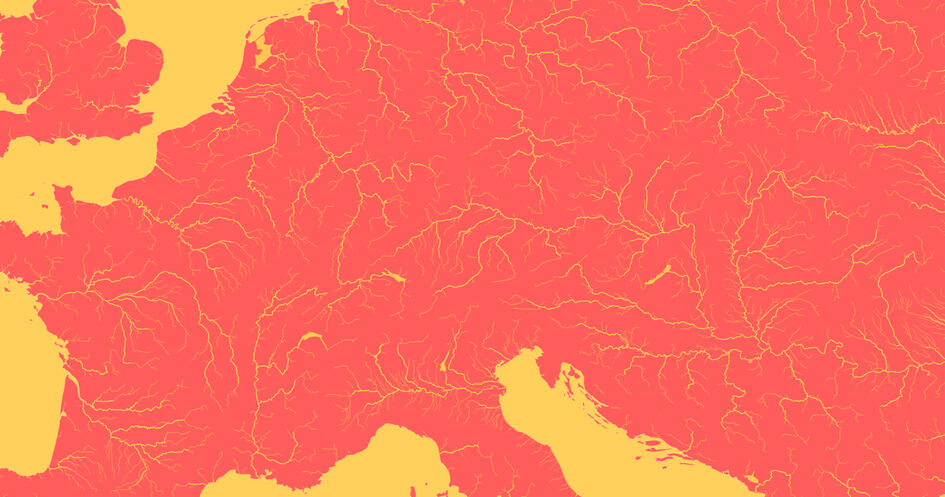
Filtering data is very useful when the data you have is too detailed (for example HydroSHEDS) and you want to make it less detailed. When you right click on a layer in the 'layer' box on the bottom left of the screen (discussed earlier), you'll see a popup menu appear.
In it, there'll be an option called 'filter'. Now, depending on what resource you're trying to filter, the 'fields' tab will look different. What I've found is the best way (if there isn't a guide) is to play around with the different 'fields' until you find something that gives the desired result.
Most of the 'operators are self-explanatory. A better guide than I'd make can be found if you just search "Expressions - Qgis documentation" or something like that.
Georeferencing
Georeferencing allows you to take maps you've downloaded and put them into Qgis, which is very useful if you want to draw something that doesn't have it's own resource in Qgis (for example some borders in the 1500s).
If you go to "Raster" at the top of the screen and click it, you'll see a dropdown menu. In it, click georeferencing. You'll then get a popup that looks something like this.
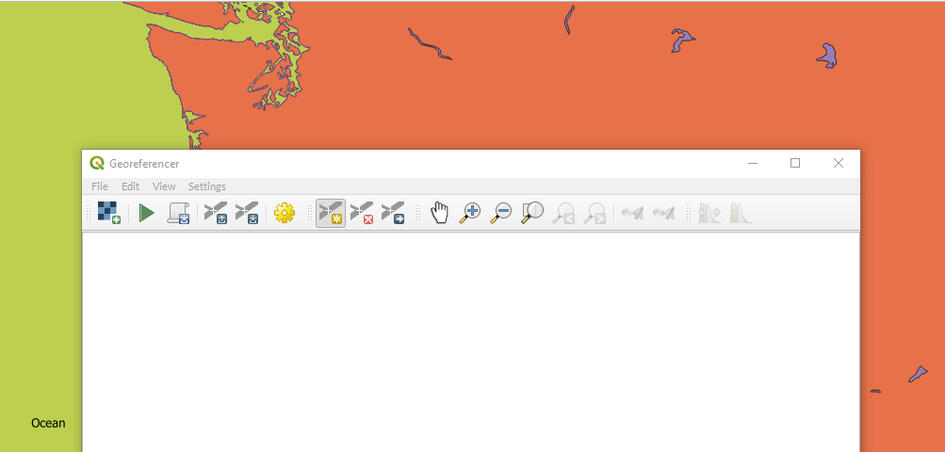
(Note: The box extends further down than this)
You insert a map (has to be a raster, like PNG or JPEG) and then to start georeferencing you need to go back to the icon with the little yellow square. That one adds points, while the red one deletes points and the blue one moves them. you click on a point on the map you imported (E.G an island or a buckle in the coastline and then choose from map canvas and click that point on your map canvas (where your data/map is shown).
Before clicking the green arrow to georeference you need to have the correct settings. Click on the yellow gear icon to open settings. Change the transformation type from 'linear' to 'Thin plate spline' and put the target SRS as the one you're using for the project.
The more points you place the more accurate the map you imported will be placed on the map canvas.
Projections
Map projections are important because they reduce the distortion on the place you're mapmaking. I expect that you're familiar with the problem of projecting a sphere onto the earth - which is why map projections were made.
Pressing Ctrl + Shift + P opens up the project properties, in which there's the 'CRS' tab which stands for "Coordinate Reference System." In the popup window you'll see that you're able to search for map projections.
When doing this, just type in the area you want to make a map of (or one adjacent if there's no map projection) and there'll hopefully be a projection for it.
Custom projections
Admittedly, projections in Qgis can be buggy. This is why its useful to know how to make a custom projection. This can be done on the "projection wizard" site. It allows you to make a map projection for an area which you can specify with a box you can resize and drag around.
After you've picked an area and a projection you want to use, you click the little blue text saying 'WKT' which stands for "Well Known Text." It's basically a way to specify map projections.
Anyways, copy the WKT that popped up. Go back to Qgis & click the "settings" tab at the top (next to plugins & click custom projections.
Click the green plus arrow in the popup window to make a new projection, enter a title for the projection, paste in the WKT into the little box below made for it, and click 'OK' to save it.
You can now go back to the 'project properties' window (ctrl + shift + p) and search for the name of the projection you made. You can now use it like a normal projection.
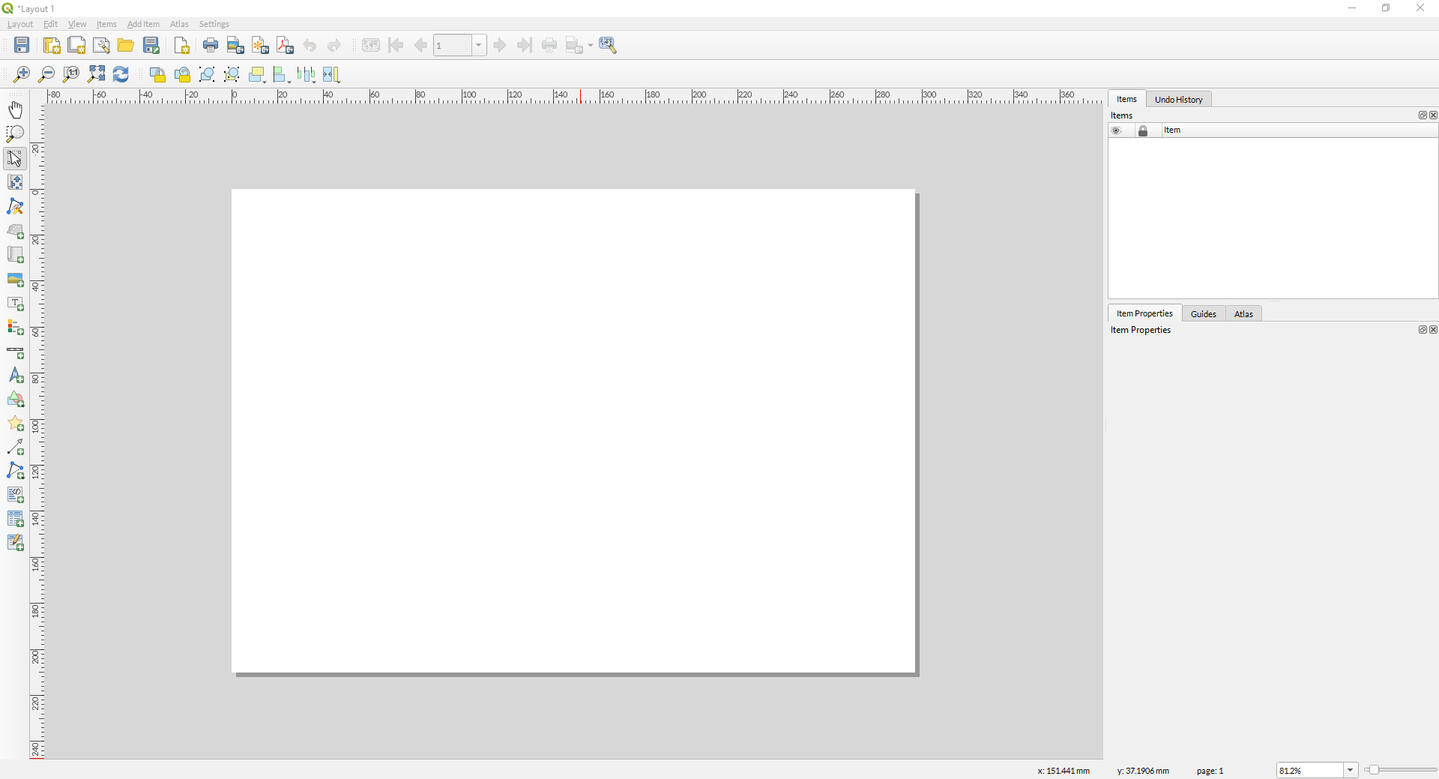
Using the export menu
First you need to press CTRL + P. Doing this opens opens a menu to create the print layout title, if you haven’t done that you type in the name of the map that you will export (Note: you can change this later) Simply click OK and a new window will open.
Now, before you start you most definitely want to change the canvas extent (unless its for print). This is done by right clicking on the blank page and clicking "page properties" in the popup window that appears.
You can now see the "Page size." Click on the part that says 'A4', scroll down, and change it to 'custom'. You can now change the dimensions of the page. If you click the button that says what unit the page is in (the default is millimetres/mm you can change it to pixels, which is often more useful when working online.
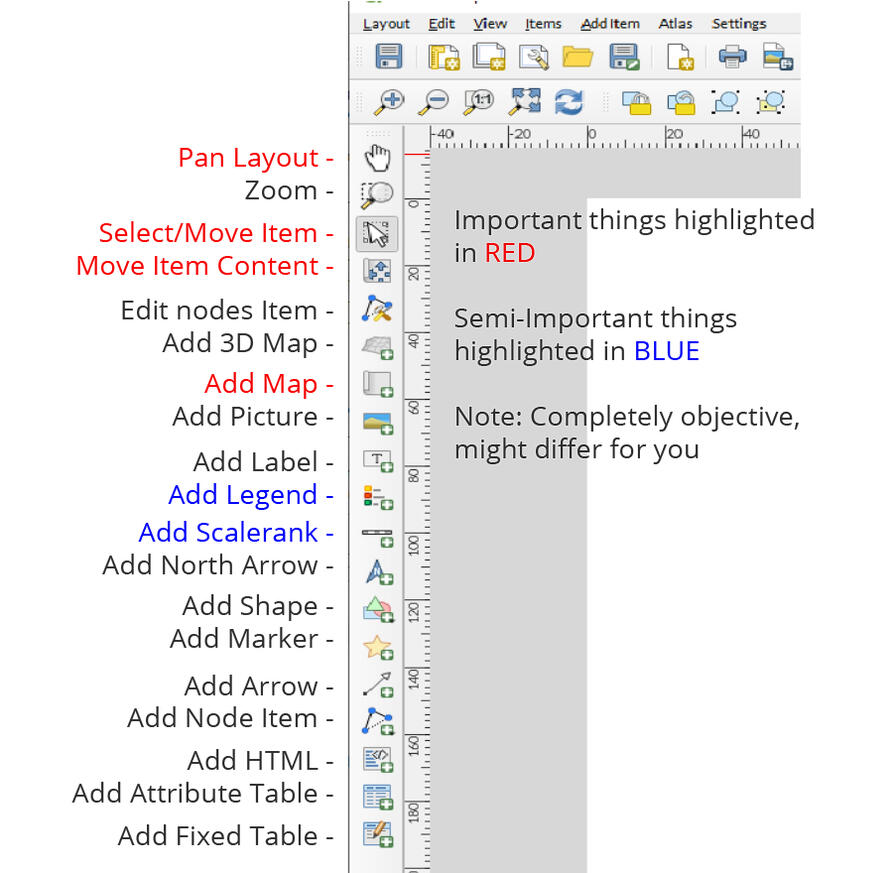
You click "add map" to add your map from the map canvas. It'll most likely not be fitted to the edge, so you can use the 'select/move item' to drag its boundaries to the edges. Now, it'll most likely be too zoomed out so you can use the "move item content" and use the scroll wheel to zoom in and clicking and dragging with the left mouse button while still in the "move item content" to move the map itself around.
Pan layout can be used if you've zoomed in with the "select/move item" and want to pan around without moving the map.
Exporting
To export the map you go to Layout (in the top left), then you click either "export as SVG" or "export as PNG". Now, what you want to export it as depends on the program, which is what the next section is about.
(Note, if you're going to edit it in a raster program (like Paint.net) you want to export all of the Qgis layers as seperate layers. However, I strongly recommend you use a vector program.)
When exporting as a .svg file, make sure you 'always export text as objects', 'RDF metadata' is up to you, but I usually turn it off, the most important thing to do is to 'always export as vectors' and to 'export map layers as svg groups'
Export as .png or .svg?
SVG is a vector file format, while PNG is a raster format. What you want to export it as largely depends on what program you're going to edit the rest of the map in, but in general I suggest you export it as an SVG file when possible.
Since Inkscape is a free vector program it's very possible to make maps in it. However, if you have Photoshop or Illustrator I recommend you learn how to use them.
Other tutorials & guides
Questions?
Email me & I'll try to get back to you when possible